I was a bit (tiny bit) off about Mauritius. It’s actually (citing Wiki here) “an island nation off the coast of the African continent in the southwest Indian Ocean, about 900 kilometres (560 mi) east of Madagascar” (not exactly Greece…). Here’s a map:

See the little “A” there, well that’s where it is. Seems a bit “lost” and a bit small too. Don’t know if I’d trust them with my real money…
Here’s a zoomed out map:
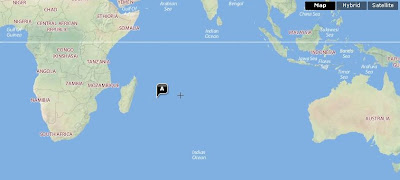
Really seems to be almost in the middle of nowhere. But look a this:

Looks nice and quiet and relaxing and well, maybe when my account reaches some target number at some point I’ll go visit ;-)).
In the meantime, let’s get back to trading!
Go to article 23
Article 23 - April 9, 2009 - It’s a broker thing
My trades on FX Open have no error message whatsoever. On other account, I still get the zero error thing PLUS a new message in the journal, which this time, instead of [too many requests] says [common error].
In the meantime, here’s what happened today in our ranging account (I’ve had some technical problems with the trending one, only two trades were taken, then nothing, so I shut down and restarted a few hours ago, and things seem to be OK now).
Closed trades for today:

As you can see, 2 trades hit their stop losses and the rest (7 trades) retraced nicely for a total profit for today of $485 US. I forgot to switch the profit column to pips, so I’ll do it right now so you can get a clearer idea of the pipeage and not the $ worth next time.
Go to article 24
Article 24 - April 12, 2009 - Happy Easter
I though my broker would be closed this Sunday evening, but they’re open. I think they’ll close at midnight (my time) and re-open Monday at midnight, at least that’s what my other brokoer used to do. I’ll wait and see what people in Mauritius will do. Come to think of it, they’re probably part of the Australian “market” which for me, opens at 5pm EST.
Anyway, here’s what markets look like a half hour after opening. And I DID check to make sure I wasn’t seeing mega imaginary gaps this time – these are real. Look at AUDUSD:

The 2 worst cases of gapping are AUDUSD and GBPAUD. What’s strange (or might be the reason?) is that Australian markets are technically closed (so why is my broker open hmmm?). Anyway, here’s the current calendar from Forex Factory:

As you can see, it’s Easter ! So not much trading until Tuesday. When I started trading, I was so angry at this, I remember. I had a COMPLETE day off to trade because of the holiday, only to realize that markets were closed. Some brokers still stay open, but as you’ll see, not much happens because (I’m told) of poor liquidity. But still, tiny retail traders like us manage to move things “a little” ;-)
Alright, so I’ll be monitoring the markets up until Tuesday without expecting much to happen but with Forex, who knows what can happen?
Go to article 25
Article 25 - April 17, 2009 - Busy, busy, busy!
I was overly busy for the rest of the week with a contract I got with a (more than) tight deadline. I’m not finished yet – expect to work over the week-end as the delivery date is Monday. Markets were fairly quiet (by that I mean both systems were fairly equal) so no trading for me this week (again, yes I know, but PATIENCE).
But had I decided to go ahead with a clear setup, I could have worked AND traded – that’s the beauty of the robots.
There’s an indicator I’ve been meaning to share with you for the ranging system, I hope to get a minute during the week-end to show you this quite beautiful (yes beautiful!) indicator. I baptized it “Serenity” when I put it up on a graph the first time, you’ll see why.
Go to article 26
Article 26 - April 20, 2009 - Centre of Gravity
What a week-end! I didn’t stop.
Anyway, I mentioned a “beautiful” indicator in my last article which I had baptized “serenity” the first time I placed it on a graph. After having tried so many indicators/systems with a gazillion bells and whistles, this one was for me. I used it on the dailies at the beginning of last year and it worked like a charm for months. Then came the mega trending period starting in July-August and because I was so “married” to this indicator, I omitted to keep my eyes open and SEE what was happening (the pairs were breaking the indicator’s rules, so to speak and I kept telling the pairs they couldn’t be doing this).
But it is a great break-out indicator as well as range indicator. With some hindsight, I think we could integrate it to the current systems I never used it on the hourlies, only the dailies, but I suppose it should give us a good indication on the 1H and will simply be an added security or filter, if you like, or better, a “second opinion”. But you don’t have to use it if you don’t want. It’s just another “edge”.
Alright, so it’s called Centre of Gravity. There are a few versions out there, don’t know if they’re all programmed the same, but this is the authentic one. I’ve got an explanation somewhere on what exactly it calculates (its algorithms). I’ll try to find it in my zillion sub-directories and upload it to the file download link. But for now, here’s what one of my chart looked like last year (it’s current data, but with my old set-up):

Isn’t this beautiful? And serene? Quiet, even. Remember these are the dailies and the COG covers 7 months, from about the beginning of September 2008. I was using a line graph instead of candles or bars because it made things clearer and simpler. Now, the white line in the middle acts as a pivot and the price tends to revert back to it. The green and yellow lines act as support and resistance. These are the critical areas for ranging.
I don’t have an image example, but when the ranging turns into trending, the price “goes out of its way” either past the supports or resistances kind of ignoring the boundaries (while you go WTF? or at least I did). I wish I still had my pix from back when this happened last year. All the AUD pairs were particularly frightening to look at. Anyway, that’s our cue that things are getting out of hand, or in other words, that the regular ranging is turning into mega bear or mega bull, so we adjust our trading accordingly. You can adjust the setting to the back number of bars you wish. I find that about 7-8 months worth gives a good idea (on the dailies).
Notice also the curve almost reminds us of a rainbow. Well, when the rainbow vanishes, you’ll see that the lines become more and more parallel. And once they’re really parallel, it’s your cue to start taking the retracements and ride the wave. If I remember correctly, the NZD pairs were real easy to trade as they were like parallel AND almost vertical. Too bad I can’t find those pics grrrrr.
So anyway, if you want to use this indi, just remember that curves mean ranging and parralel (I never could spell that word) mean trending.
Go to article 27
Article 27 - April 21, 2009 - Example using the Centre of Gravity
Here’s a EURGBP trade taken a few hours ago:
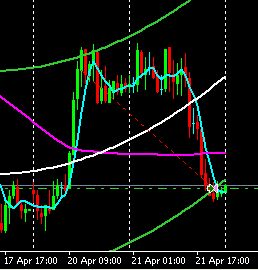
What I love about this is that the MAs crossed PLUS the price was in the critical area (the lower green line) of the Centre of Gravity, PLUS we’re in an uptrend and we entered long, so in principle we’ve got triple chances that this will retrace nicely back up to meet the pivot. I took this trade manually in my real account and if you don’t want to use the robots, of course you can do this. Just use the system to show you where there’s a good set-up and enter manually. Now if this thing keeps going down, it’ll mean that it decided to start trending in my face (which is possible of course) so I’ve got my stop loss in place. I’ll keep you updated on the progress. In the meantime, I’ll go search for the explanation file on the algorithm behind the COG.
Go to article 28
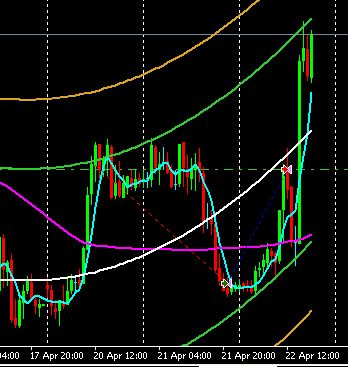
Article 28 - April 22, 2009 – Result for EURGBP
Here’s what happened to EURGBP……………..
Go to article 29
Article 29 - April 24, 2009 - Friday Close
Yet another week comes to a close. For me it was a good one, with +155 pips.
I'll upload the explanation on the Centre of Gravity so you can get it on the DOWNLOAD link. Hope this helps you understand how this indicator can be used as a “filter”.
OK, I’m off now, and I wish everyone a great week-end. See you at Sunday open!!!
Go to article 30
